Well, it’s getting to be crunch time in Common Core Algebra II now that April looms before us. As at Arlington, I’m sure that many districts are beginning Probability soon and will then turn to statistics in Common Core Algebra II.
I still am a little in the dark about the expectations that the state has in terms of what it wants students to know and be able to do when it comes to inferential statistics. Some of what we know comes from the CC Standards themselves, some comes from the Modules, and some comes from the sample questions. But, these three things are often contradictory.
At the end of the day, I feel like the original curriculum that I created does a good job at using Statistical Simulation to give students a good feel for how probability ties into inferential statistics. I’ve written statistical simulators for the TI-83/84 calculators and much, much faster simulators that are web-based. I describe all of these simulators in detail and supply links to the calculator code and web based apps in this earlier post of mine:
Statistical Simulation in Common Core Algebra II
I decided to add three additional lessons to the inferential statistics curriculum and am offering them up here in their pdf form. The answer keys will be available on the new answer key for CC Algebra II but aren’t available now. These three lessons take a more classic, formula based approach to inferential statistics, particularly margin of error for both means and proportions. The lessons are numbered a bit strangely because they will fit after all of the other simulation lessons but before our final two lesson on regression. Here they are:
CCAlgII.Unit #13.Lesson #8.The Distribution of Sample Means
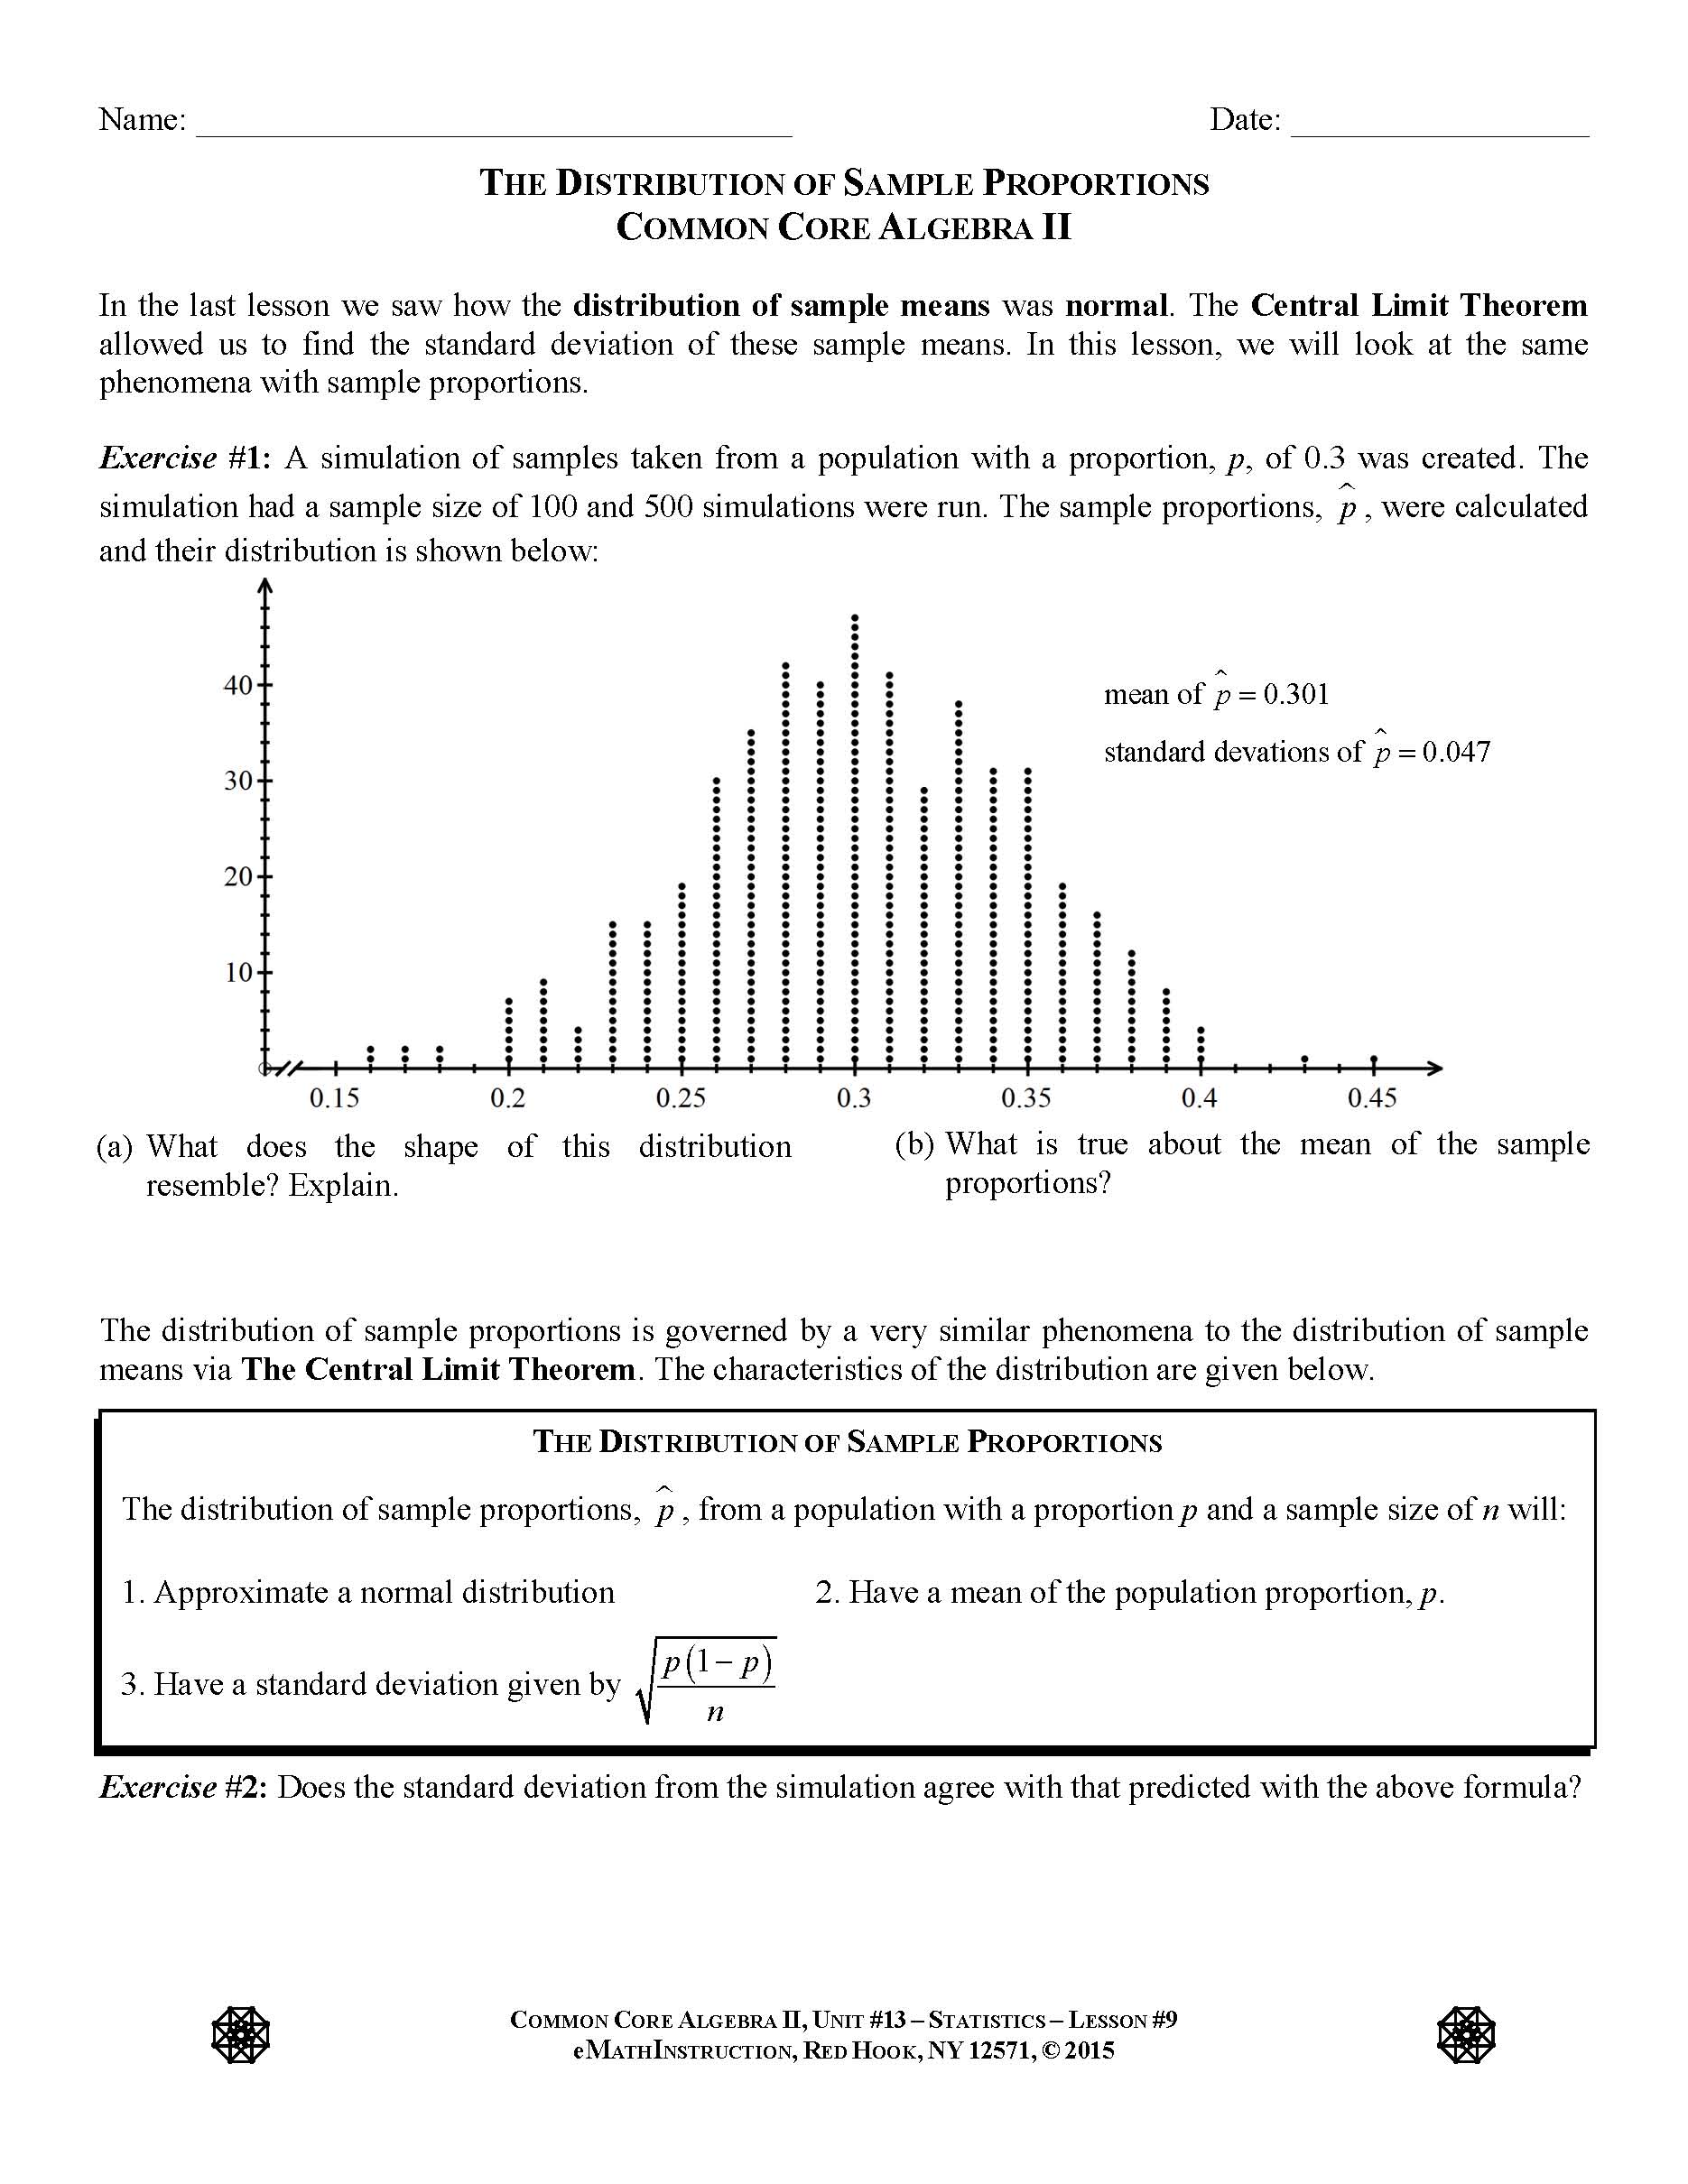
CCAlgII.Unit #13.Lesson #9.The Distribution of Sample Proportions
CCAlgII.Unit #13.Lesson #10.Margin of Error


Thank you for using eMATHinstruction materials. In order to continue to provide high quality mathematics resources to you and your students we respectfully request that you do not post this or any of our files on any website. Doing so is a violation of copyright. Using these materials implies you agree to our terms and conditions and single user license agreement.
Thank you for using eMATHinstruction materials. In order to continue to provide high quality mathematics resources to you and your students we respectfully request that you do not post this or any of our files on any website. Doing so is a violation of copyright. Using these materials implies you agree to our terms and conditions and single user license agreement.
The content you are trying to access requires a membership. If you already have a plan, please login. If you need to purchase a membership we offer yearly memberships for tutors and teachers and special bulk discounts for schools.
Sorry, the content you are trying to access requires verification that you are a mathematics teacher. Please click the link below to submit your verification request.