So, recently I posted one of my favorite Desmos graphs ever. Since I was in middle school, I’ve been drawing those doodles where you connect points on a y-axis with points on an x-axis in the following way:
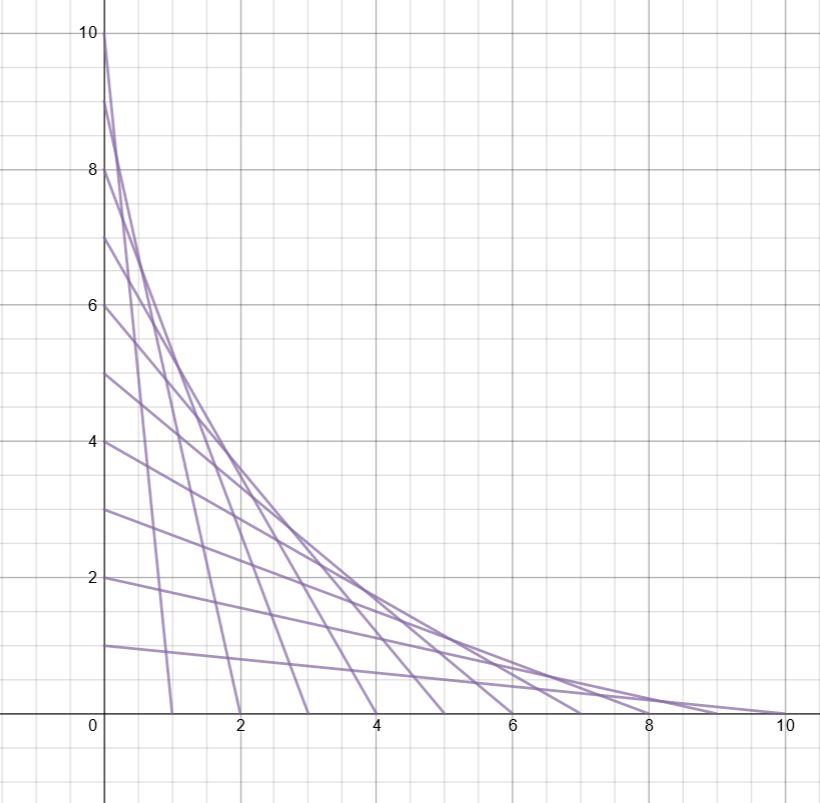
I loved this as a kid because the more lines I drew, the more the boundary looked like a smooth curve, even though I knew it was created by straight lines. You can experiment with it on Desmos by clicking on:
Now, about 10 years ago, I was sitting around the faculty room wondering what the equation of the bounding curve is or even if there is one. Take a look at the graph with 30 lines:
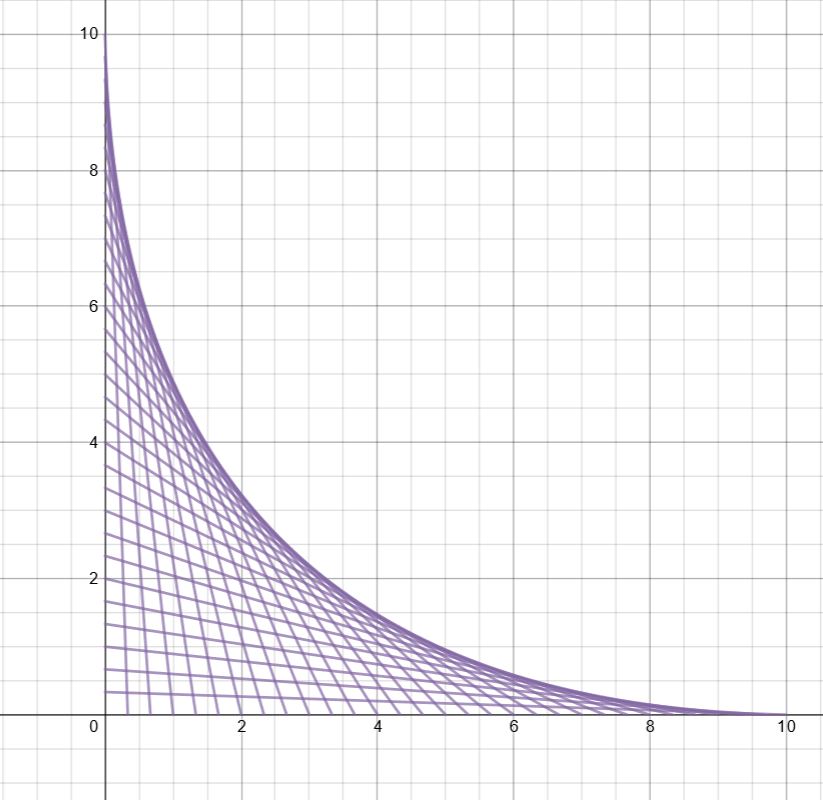
Seems pretty clear that there is a bounding curve. But, if that image doesn’t convince you, maybe the one with 100 lines will:
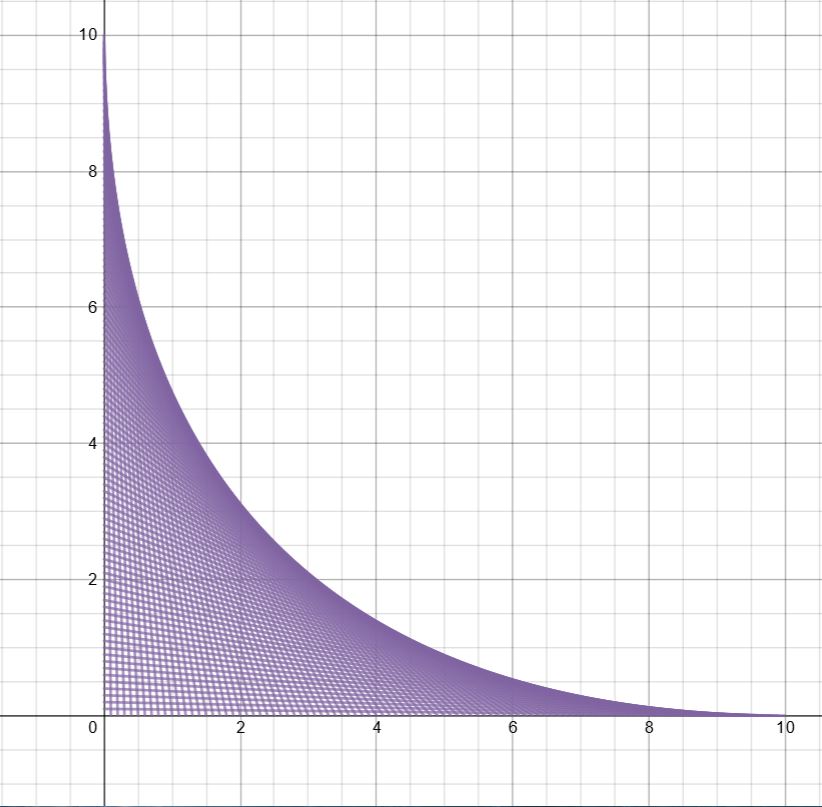
Clearly, there is a smooth curve that bounds these lines as their number heads to infinity. BUT WHAT IS ITS EQUATION? Just to visualize it better, here’s the 100 line graph in orange with the boundary curve in black:

And, here’s the boundary curve (or what I think is) by itself:
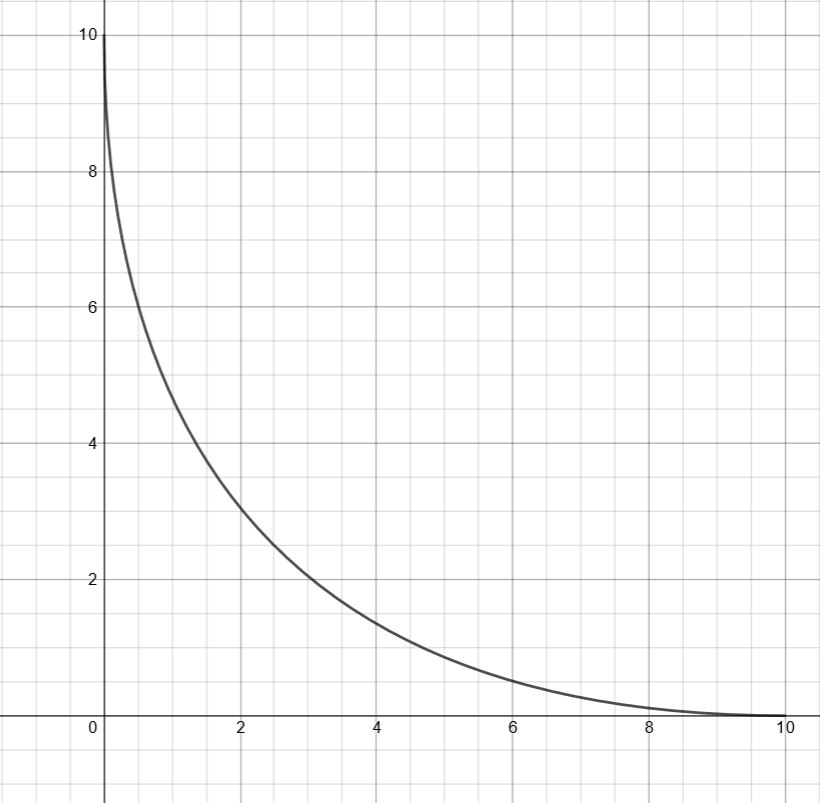
Again, my driving question for the better part of a decade is what the equation of the curve is.
I think I’ve found it, but want to toss it out to the MathTwitterBlogosphere (#mtbos) to see what other think. I’m happy with my solution, but feel like it may still not be correct. So, if anyone has thoughts, communicate them to me, either via email or Twitter or as a comment on this page or on Facebook.
Have at it Math Geeks!
I figured out a pattern for the coordinates of your 10×10 that should work for larger nxn grids. I tried to find the intersection points with two sequential lines at a time. If n=10, then both x and y’s coordinates have n+1 or 11 in their denominators, while their numerators begin with the products of 0x1 for the x-coordinates’s numerator, then 1×2, 2×3,3×4,etc.until the last point has a numerator of 10×11. The numerators of the y-coordinates begin with 10×11, 9×10,8×9,etc. down to 0x1. If I eliminate the last point (10,0) then it fits the exponential function y=9.1687063(0.636986717)^x pretty well, but other than refining this process for ever larger values of n and hopefully finding some “limits” of the values of “a” and “b” (like does it approach y=10(.5)^x ?), I can’t come up with a good way yet for expressing the pattern algebraically. Any hints? (I haven’t tried Desmos yet, either.)
Ellen. I didn’t go with intersecting lines, although that might very well work. I played around with calculus to try to determine the slope of the bounding curve based on the x-coordinate. Another math teacher used Geogebra to come up with a conic like equation for it. I powered through using calculus.