Good morning everyone. I’m writing today from my house in Red Hook, New York, just a hundred miles or so north of New York City. We’ve had three nor’easters in the last week with another possible one next week. You might call this serious winter. We just call it March. And since it is mid-March, it’s time to put out the eMath March Newsletter. We’ve got plenty to report and add-ons to discuss, so let’s get to it.
This month for our Algebra I Add-Ons we bring you a new lesson in statistics. Unit 10.Lesson 4.5 is on the subject of outliers, how to identify them and what the effect of removing them is on the statistics for a data set. We stick to the standard definition of an outlier being any data value ± 1.5IQR below or above the first or third quartiles, respectively. On the New York State Regents Exam in Algebra I, we’ve repeatedly seen multiple choice exam questions that require knowing this definition, for example #16 on the January 2018 exam:
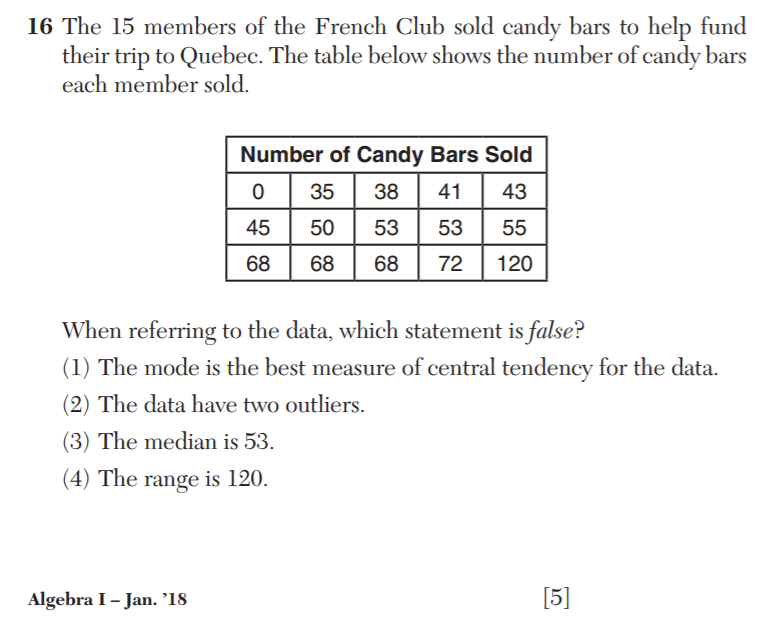
To rule out (2) as the correct choice, think about how much work must be done. They must calculate Q1 and Q3, 41 and 68, then the IQR (27), and then 1.5*IQR (40.5). Subtracted and added to Q1 and Q3 gives you a “non-outlier” range of 0.5 to 108.5. Notice how this makes the 120 clearly an outlier but the data point of 0 is barely an outlier. So, it’s pretty important to know this technical definition of an outlier (which is not universally accepted) in order to not choose (2). Given the rather subjective nature of the correct answer, i.e. (1) that the mode is the “best” measure of central tendency, it is important to know why each of the other statements is true. Don’t get me wrong, I don’t think it is unreasonable for kids to know this, but I think that this is the type of curricular detail that needs to be explicitly spelled out as a piece of knowledge kids must learn.
We created two new videos for Common Core Algebra I. One of them goes with our add-on lesson Unit 8.Lesson 7.5.Linear-Quadratic systems. We also did a short video on a graphical reason for why the method of completing the square works. Both of these videos will be posted soon with a QR code added to the lesson when finished (likely today or Monday).
For Common Core Geometry, we have finally finished our Unit Reviews and Unit Assessments with Unit 10 – Measurement and Modeling. We have a fantastic Review with lots and lots of modeling problems, including additional density problems. These Reviews and Assessments finish Version 1 of our Common Core Geometry curriculum. We will begin releasing add-ons (additional lessons, activities, and assessments) beginning in August of 2018.
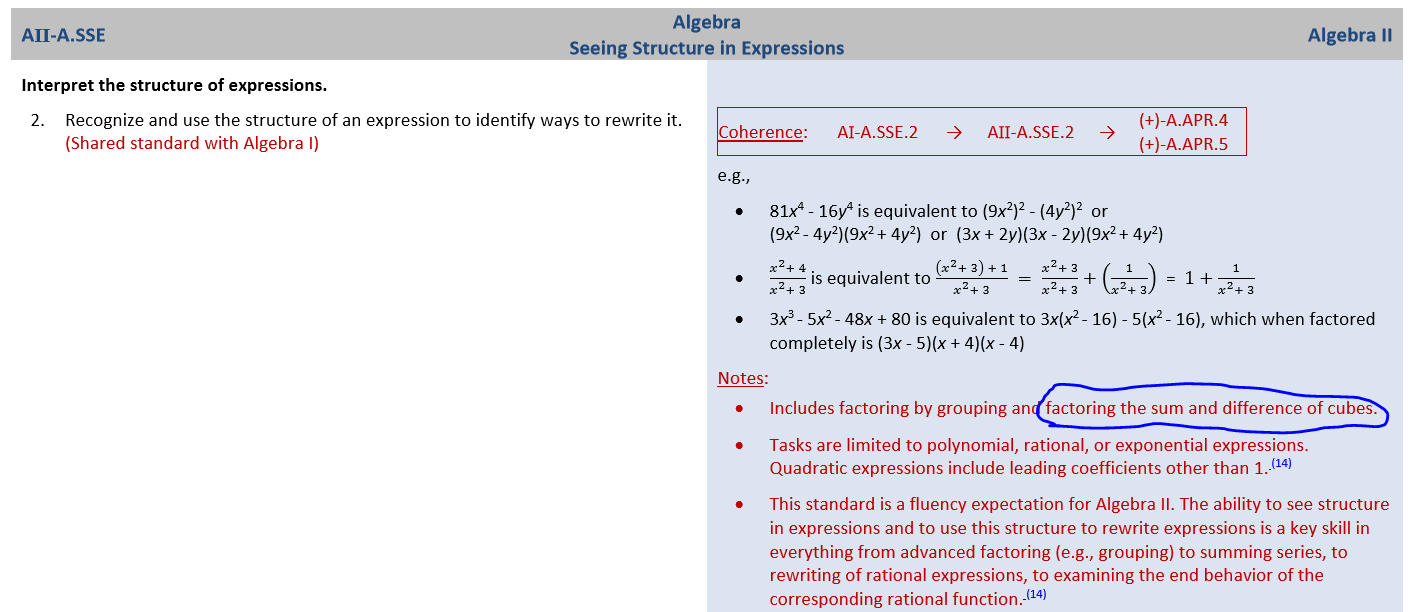
For our Common Core Algebra II Add-Ons, we’ve created a lesson, a mid-unit quiz (form B), and a video. Let’s start off with Unit 11.Lesson 8.5.More Work Graphing Sine and Cosine. This is a huge set of problems that give kids basic work graphing the sine and cosine function including amplitude, midline, and frequency (no horizontal shifting). We also give them a variety of curves and have them come up with the equations. This is an excellent problem set to give to kids over spring break (coming soon hopefully to a school near you). We also created a Form B of our Unit 11 (Trig) mid-unit quiz. We reposted the Form A quiz and you now have two similar quizzes to test their knowledge half-way through the Trigonometry (Circular functions) unit. Finally, we created a video to go with our Unit 10 lesson on the Sum and Difference of Perfect Cubes. I must say I’m disappointed that this topic got approved for the Next Generation Learning Standards at the Algebra II level:
I find almost no utility in having kids memorize:
and
I do think they are interesting patterns to study. I think the connections that can be made between these problems and the imaginary roots of quadratics are quite interesting. But, I see no utility in any type of realistic math problems where memorization of these patterns is helpful. I think it just takes up time and mental space that could be spent better elsewhere. What are your thoughts?
Finally, we have our Algebra 2 and Trigonometry add-on of the month. This month we’ve added an additional lesson in Unit 10 (Exponential and Logarithmic Functions). We’ve put in Lesson 4.5 on Additional Exponential Modeling. In this lesson we look at how to transition between different time units when modeling something using exponential growth and decay. This is a particularly nice lesson from an applied perspective.
That’s it for add-ons, but I’d like to keep discussing a bit more. Let’s begin with a cool 3D visualizing program for Geometry teachers that many of you likely have if you bought a PC within the last 3 years. All Windows 10 computers (and I believe some Windows 8) come with a program called 3D Builder:

Just type its name into your Search bar on a PC to see if you have it. Now, this program wasn’t installed because Microsoft thinks we are all Geometry teachers. Nope! This is a program designed to allow you to create 3D printer files. But, that doesn’t mean it isn’t great for 3D modeling. For example, remember the water-tower problem on the first CC Geometry Regents exam:
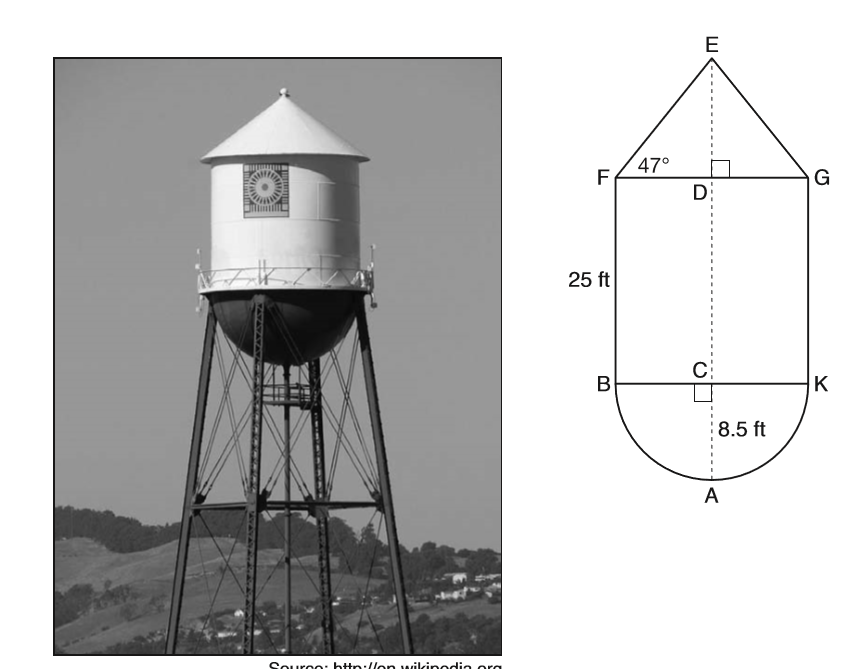
Now, imagine making the problem come alive by showing the students not just a model of it on 3D Builder but also that model taken apart into the three component pieces:

One of my favorite parts of this program is its Split command under the Edit Menu:
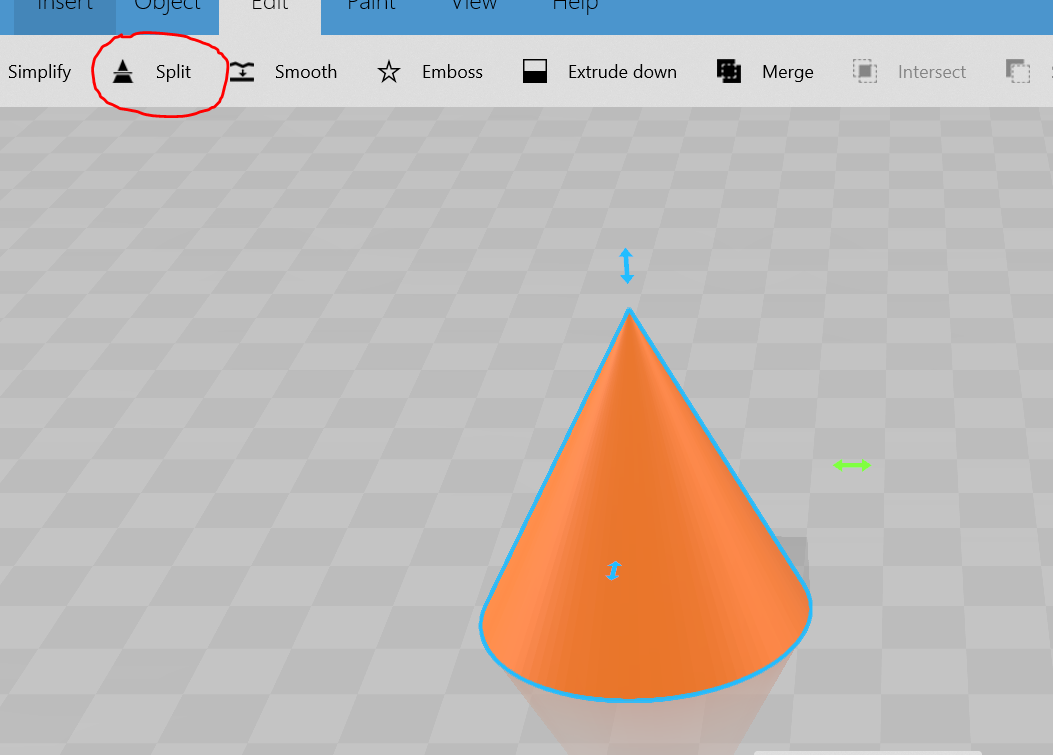
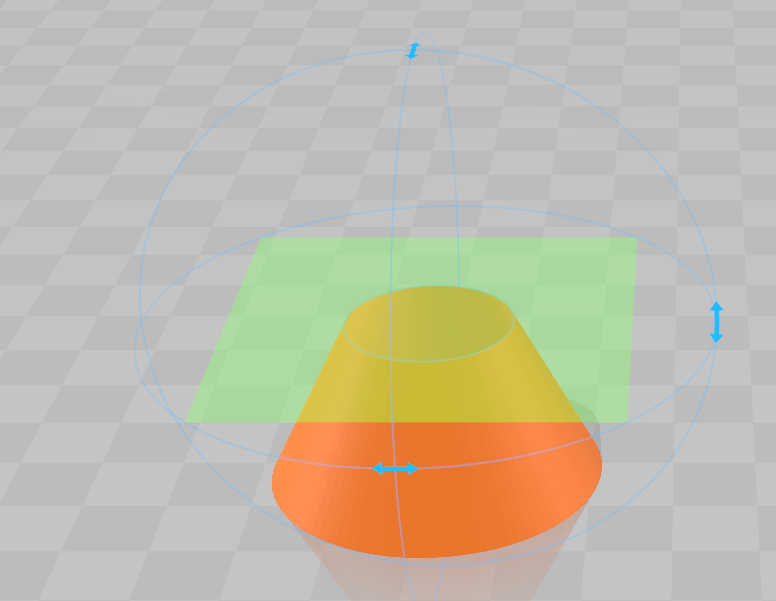
This function’s purpose is to slice a 3D object using a plane so that you only keep part of it to print. BUT, Geometry teachers can use it to show kids cross-sections of any orientation. With our cone example, here is an example of it showing a horizontal cross-section:
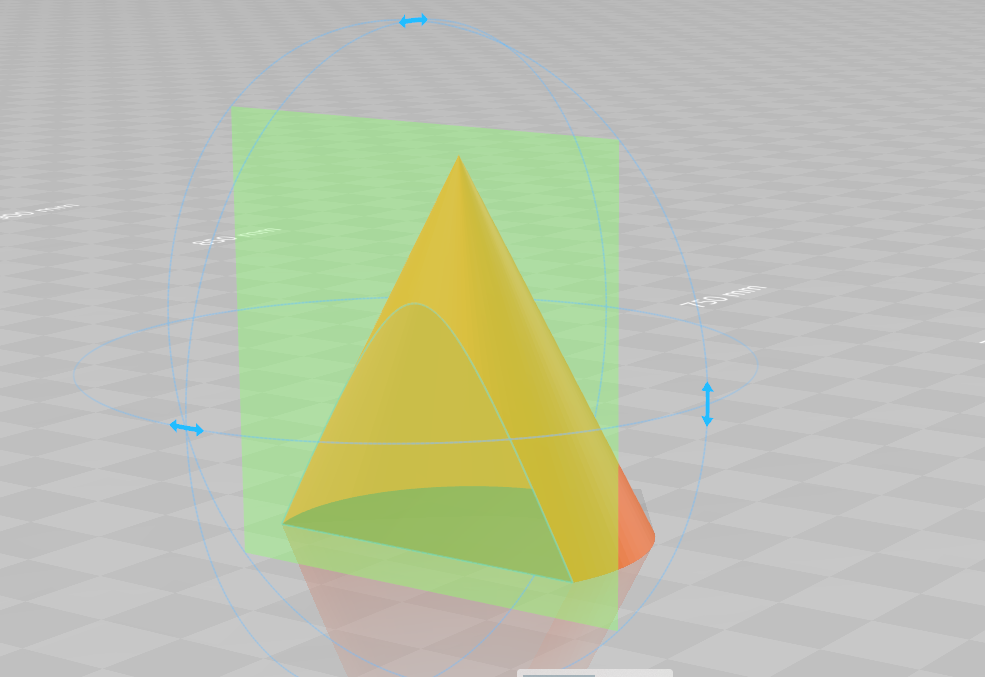
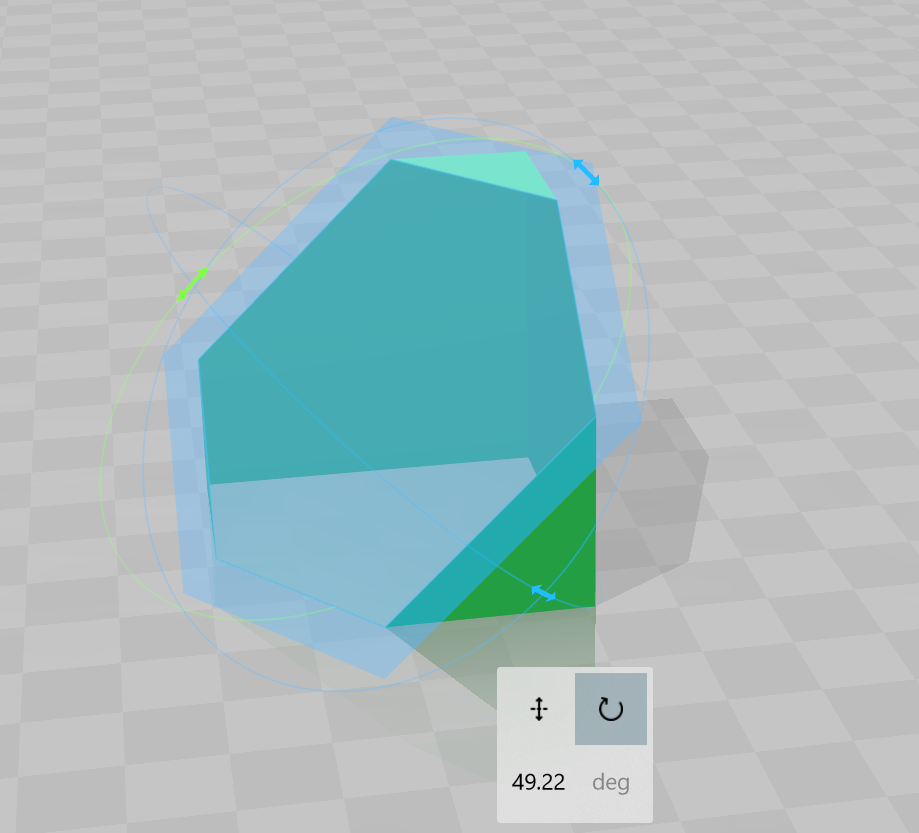
Notice those rotation arrows? They allow you to rotate the slicing plane into any orientation. So, if you wanted to see a classic vertical cross-section you could just rotate the plane 90 degrees to get:
Or, my favorite, the elliptical cross-section formed when slicing with an inclined plane:
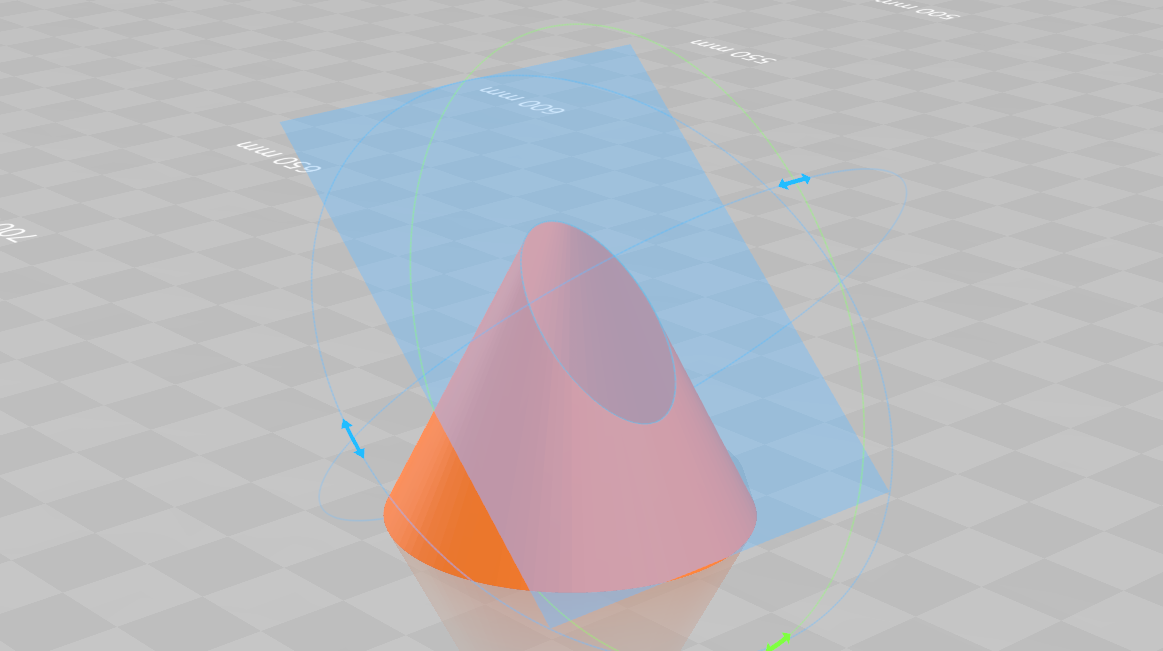
Once you’ve rotated the plane, you can then move it left, right, up and down, allowing you to show kids how cross sections can change as you move the slicing plane in various directions. The Next Gen standards for Geometry state that kids will need to be able to visualize cross-sections of common solids, even with planes that are not horizontal or vertical:
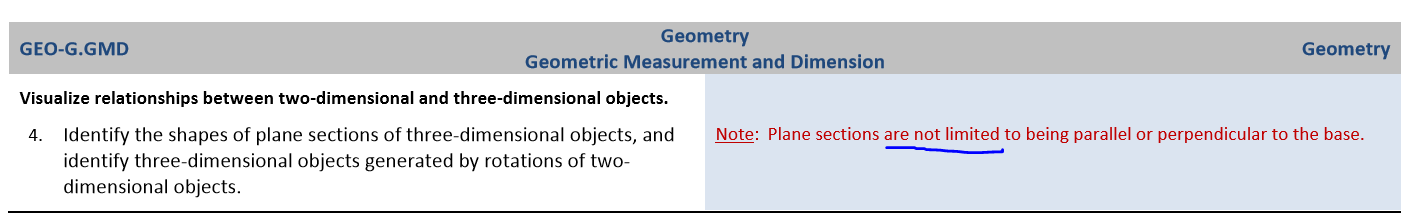
Will they have to recognize that certain cross-sections of cubes are hexagons? Inquiring minds want to know.
Well, I think that’s about it for 3D Builder. I’ll be discussing this program and Tinkercad, one of my favorite online 3D modeling programs in additional posts. Only a few years ago, visualizing 3D geometric concepts would have been very difficult. Now, programs to do so are not just easy to find, but completely free.
We have some exciting changes coming to the website in the coming months, including a new way of organizing the Add-Ons and the Assessment Items. But, more on that in the April newsletter. For now, happy Pi-Day, happy March, and enjoy your spring break if you still haven’t been on it yet.