So, I’ve been working away at finishing Common Core Algebra II. The last unit is on Statistics and a large part of it is statistical simulation, which is a very new idea not only to New York State statistics at this level, but pretty much everywhere.
Here at eMATHinstruction, we’ve been working hard to develop tools for teachers and students to run statistical simulations that are useful in understanding variability, confidence intervals and inferential statistics. Last spring, I wrote three programs for the TI-84+ that can be downloaded through this post:
TI Statistics Programs for Statistical Simulation
But, the realization dawned on me that not all students have a TI calculator and not all schools use it for instruction. So, I was at a loss. No offense to other calculator brands, but I don’t have the time to learn how to program a Casio, HP, or any other type right now.
So, I decided to have web-based simulator programs created so the three simulators could be accessed independent of calculators. Of course, this does raise problems in terms of graphing the results, but we are working on that. All results from these simulators can easily be copied and pasted into Excel or other statistical presentation programs.
Anyhow, the awesome computer science teacher at Arlington High School, Mrs. Dawn Orlik, recommended two students to me, Kyle Patterson and Talha Quereshi. Both worked very hard on the programs and both created good pages. Kyle’s were the ones I ultimately went with because of their ability to integrate seamlessly with my website.
Kyle’s programs are works in progress, but better than any that are out there right now. Check them out by clicking on any of the links below (click on the bold face title).
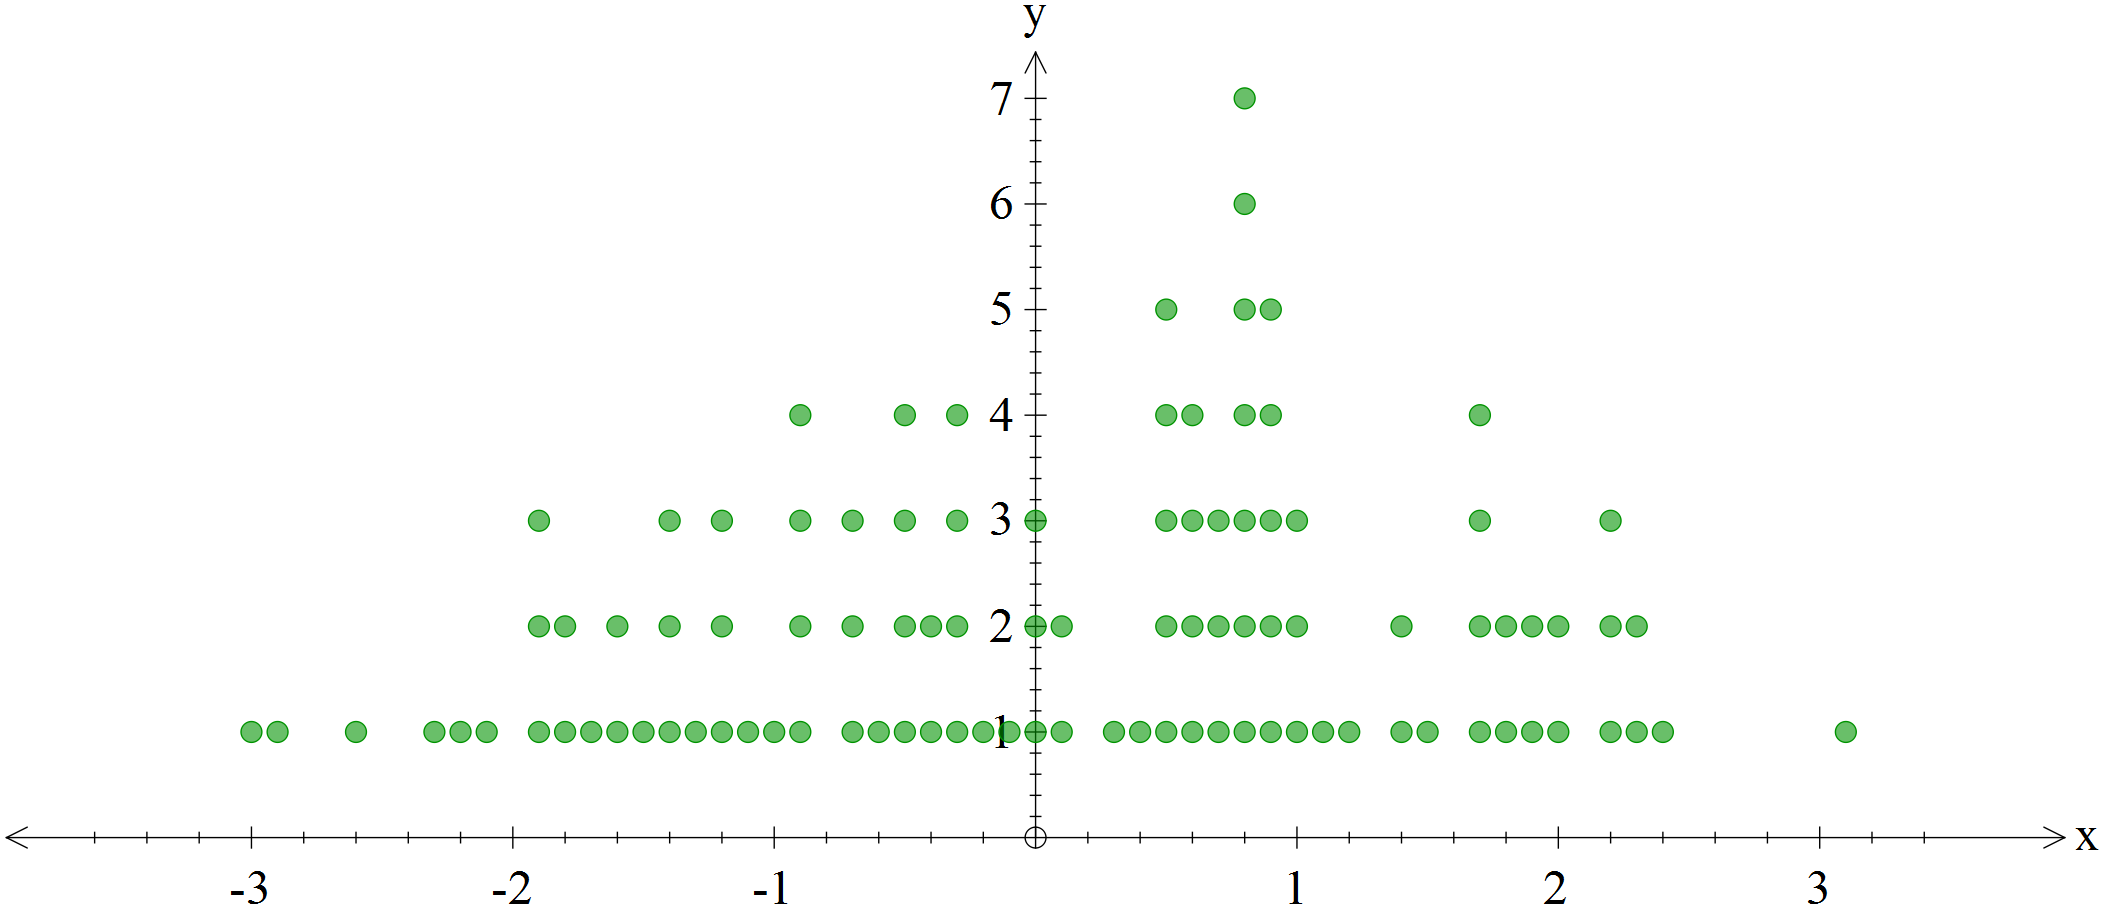
Difference in Sample Means: In this simulator, users enter two sets of data corresponding to two different experimental treatments. Don’t forget to hit the enter button. The simulator will mix the two treatment sets up and calculate the difference in sample means for as many simulations as you choose. The distribution of these random differences establishes how significant the original difference was between the two treatments means. The plot below shows simulated differences in sample means for a sample set of data in our Unit #13.Lesson #7. The original treatments had a difference of 2.3, which is rarely seen on this distribution.
Sample Normal Distribution: In this simulator, the user generates random samples of any size from a normally distributed population. The user specifies the mean and standard deviation of the population and the number of simulations. Bonus: Kyle built in two automatic histograms, one showing the distribution of sample means and one showing the distribution of sample standard deviations (click on the image below for a far better picture). This is a super great program to see how likely a sample with a particular mean would be from a population with certain characteristics.
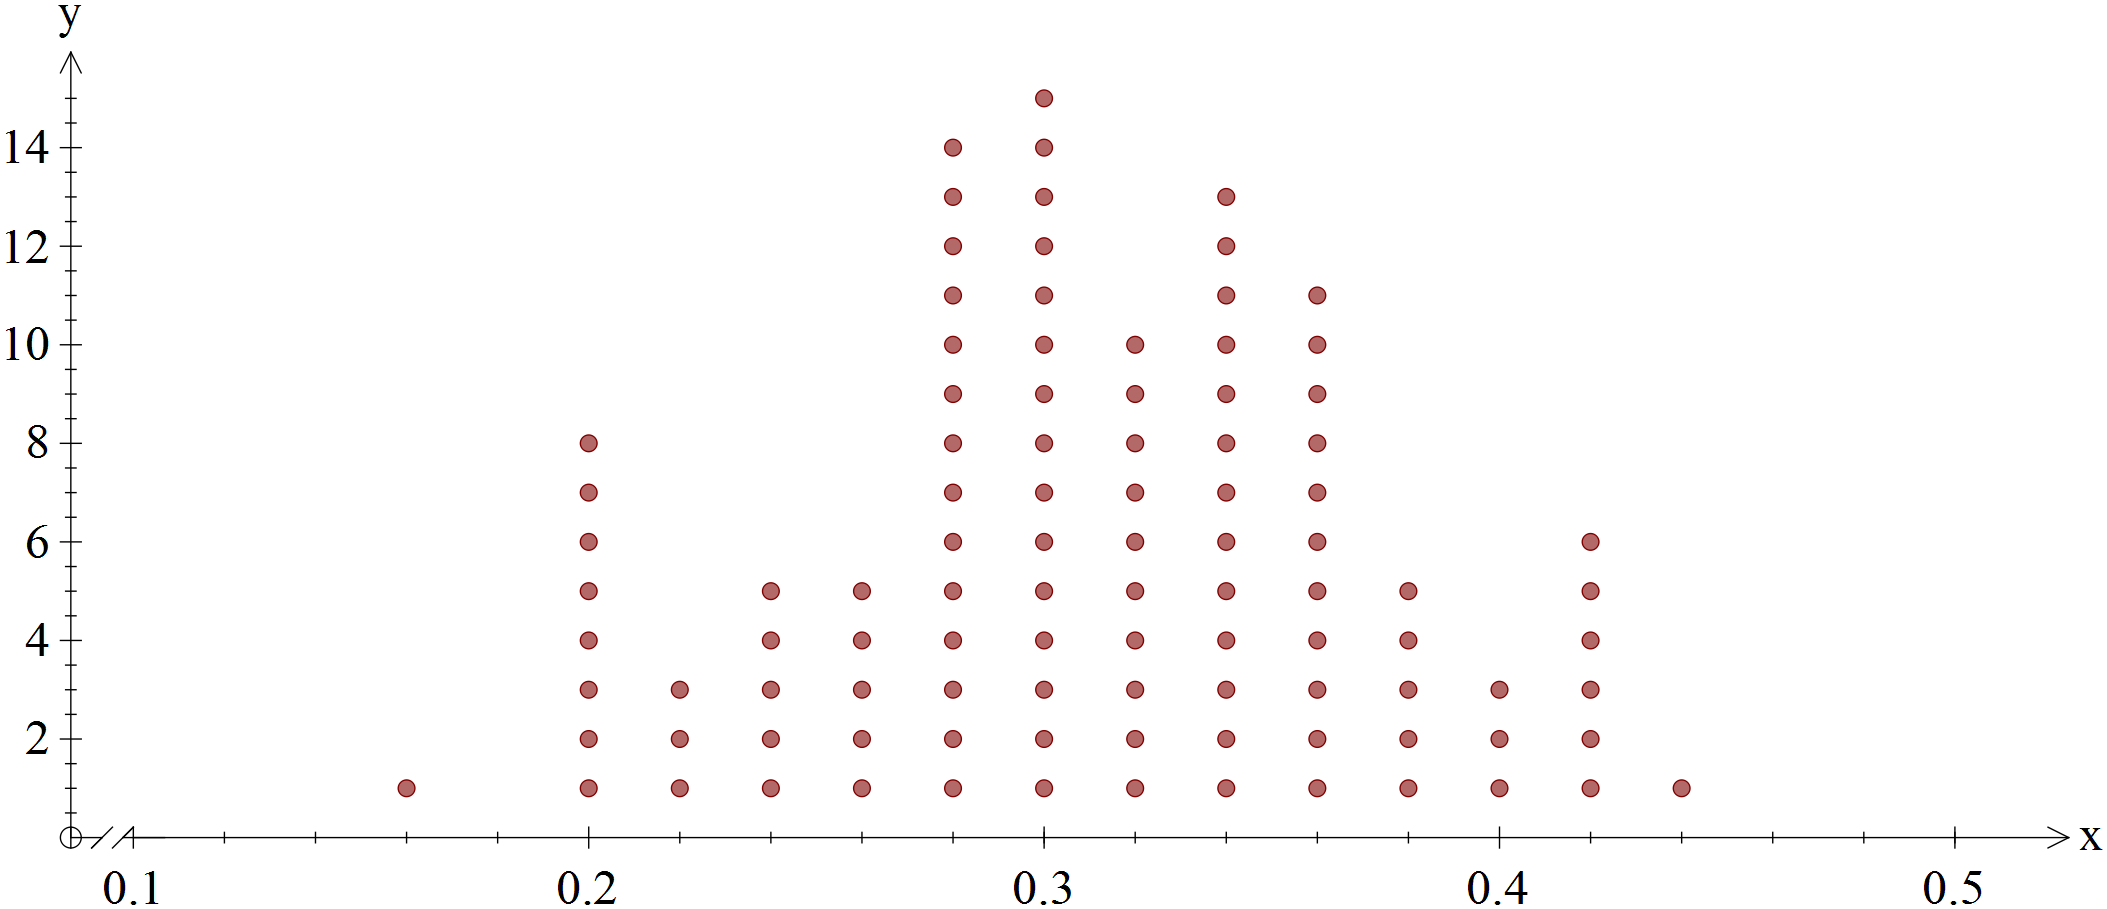
Sample Proportion Simulator: In this simulator, a user specifies a population proportion to sample from, a sample size, and a number of trials. The simulator then generates samples from a population with the specified proportion and calculates a sample proportion for each simulation trial. These sample proportions are then ranked so that the user can plot them and generate confidence intervals. The dot plot shown below shows the results from a population with a proportion of 0.3, a sample size of 50, and 100 simulations. One sample even had a proportion as low as 0.16. Cool! This is a great program to test how likely a sample proportion would be given a population proportion and sample size.
These programs will be the basis for many of the lessons in our Common Core Algebra II unit on Statistics. They will also serve as the basis for a talk I’ll be giving in Rochester in the Fall at the State AMTNYS conference. I’m excited to continue to think about the role of statistical simulation in teaching kids about inferential statistics.
I’ve been trying to use the sample normal distribution simulation, and I cannot figure out how to read the chart. How do you extract information from the histogram, especially for problems that are asking for percentiles?
It would be difficult to use the histogram to extract data good enough to determine percentiles. On the other hand, you can scroll through the actual data output in that box above the histogram. It is placed in numerical order, so if you can find the value you want in it you should then be able to calculate percentiles. I would also suggest copying the raw data over to a data processing program such as Microsoft Excel or Google Sheets. This would allow greater flexibility in working with the results.